-
.NET (.NET Core)
-
1C
-
APL
-
AWK
-
Agda
-
Agile/Scrum
-
Alef
-
Assembler
-
Basic
-
Beta Programming Language
-
Big Data/DataScience
-
C
-
C#
-
C++
-
CSS
-
Cobol
-
Crystal
-
D
-
Dart
-
DataBase (SQL)
-
Delphi
-
F#
-
Flutter
-
Fortran
-
GPT/AI/ИИ
-
GameDev
-
Git
-
Go (Golang)
-
HTML
-
Hacking and Security
-
Haskell
-
Java
-
JavaScript (JS)
-
Julia
-
Kotlin
-
Machine Learning (ML)
-
Natural language processing (NLP)
-
PHP
-
Pascal
-
Python
-
R
-
Ruby
-
Rust
-
Scratch
-
Swift
-
UML
-
UX/UI
-
Visual Basic
-
XML
-
АСУ
-
Проектирование/System Design
-
Сети/Network
-
Схемотехника/электронные схемы
-
.NET (.NET Core)
-
1C
-
APL
-
AWK
-
Agda
-
Agile/Scrum
-
Alef
-
Assembler
-
Basic
-
Beta Programming Language
-
Big Data/DataScience
-
C
-
C#
-
C++
-
CSS
-
Cobol
-
Crystal
-
D
-
Dart
-
DataBase (SQL)
-
Delphi
-
F#
-
Flutter
-
Fortran
-
GPT/AI/ИИ
-
GameDev
-
Git
-
Go (Golang)
-
HTML
-
Hacking and Security
-
Haskell
-
Java
-
JavaScript (JS)
-
Julia
-
Kotlin
-
Machine Learning (ML)
-
Natural language processing (NLP)
-
PHP
-
Pascal
-
Python
-
R
-
Ruby
-
Rust
-
Scratch
-
Swift
-
UML
-
UX/UI
-
Visual Basic
-
XML
-
АСУ
-
Проектирование/System Design
-
Сети/Network
-
Схемотехника/электронные схемы
Меню
Prototyping Python Dashboards for Scientists and Engineers: Build and Deploy a Complete Dashboard with Python
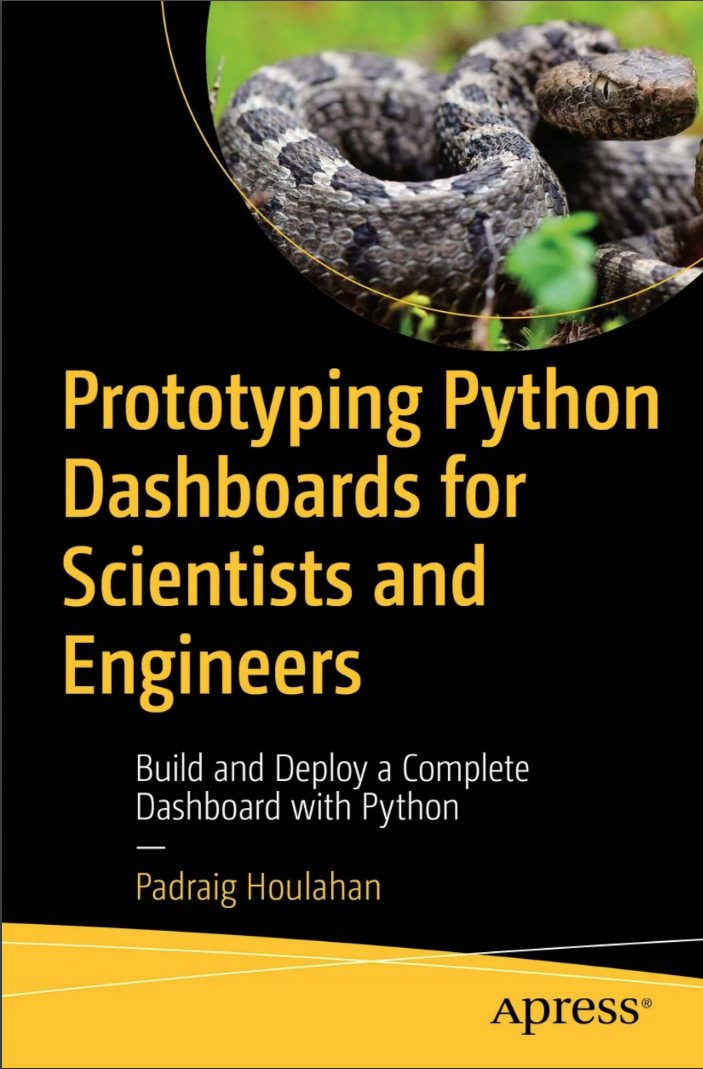
Автор: Houlahan Padraig
Дата выхода: 2024
Издательство: Apress Media, LLC.
Количество страниц: 220
Размер файла: 8,5 МБ
Тип файла: EPUB
Добавил: codelibs
Create interactive and data-driven dashboards using Python. This hands-on guide is a practical resource for those (with modest programming skills) in scientific and engineering fields looking to leverage Python's power for data visualization and analysis in a user-friendly dashboard format.
You’ll begin by gaining a fundamental understanding of Python programming, including data types, lists, dictionaries, and data structures. The book then delves into the world of reactive programming with Plotly and Dash, offering a hands-on approach to building interactive web-based dashboards. Next, you’ll see how to work with online data, how to scrape and clean datasets, and keep files up-to-date.
The book also guides you through planning a dashboard prototype, outlining project tasks, trends, forecasts, spectra, and other design considerations. It concludes with a discussion of how the dashboard can be used for data visualization of real data, explaining the usefulness of tools such as spectra.
By providing detailed examples for download and customization, Prototyping Python Dashboards for Scientists and Engineers will equip you with the skills needed to jumpstart your own development efforts.
What You’ll Learn
- Design a dashboard with Python
- Convert and filter Excel formatted files to produce CSV files
- Create browser-served graphics with PLOTLY
- Generate polynomial trend lines for forecasting
- Build a Unix service to share your dashboard
Who This Book Is For
Scientists, engineers, students, programmers, and data enthusiasts who aspire to harness Python's potential for data visualization and analysis through the creation of interactive dashboards. Many will be pragmatic programmers with modest skills and limited resources who mainly want to see a working solution they could emulate.


