-
.NET (.NET Core)
-
1C
-
APL
-
AWK
-
Agda
-
Agile/Scrum
-
Alef
-
Assembler
-
Basic
-
Beta Programming Language
-
Big Data/DataScience
-
C
-
C#
-
C++
-
CSS
-
Cobol
-
Crystal
-
D
-
Dart
-
DataBase (SQL)
-
Delphi
-
F#
-
Flutter
-
Fortran
-
GPT/AI/ИИ
-
GameDev
-
Git
-
Go (Golang)
-
HTML
-
Hacking and Security
-
Haskell
-
Java
-
JavaScript (JS)
-
Julia
-
Kotlin
-
Machine Learning (ML)
-
Natural language processing (NLP)
-
PHP
-
Pascal
-
Python
-
R
-
Ruby
-
Rust
-
Scratch
-
Swift
-
UML
-
UX/UI
-
Visual Basic
-
Wolfram
-
XML
-
АСУ
-
Проектирование/System Design
-
Сети/Network
-
Схемотехника/электронные схемы
-
.NET (.NET Core)
-
1C
-
APL
-
AWK
-
Agda
-
Agile/Scrum
-
Alef
-
Assembler
-
Basic
-
Beta Programming Language
-
Big Data/DataScience
-
C
-
C#
-
C++
-
CSS
-
Cobol
-
Crystal
-
D
-
Dart
-
DataBase (SQL)
-
Delphi
-
F#
-
Flutter
-
Fortran
-
GPT/AI/ИИ
-
GameDev
-
Git
-
Go (Golang)
-
HTML
-
Hacking and Security
-
Haskell
-
Java
-
JavaScript (JS)
-
Julia
-
Kotlin
-
Machine Learning (ML)
-
Natural language processing (NLP)
-
PHP
-
Pascal
-
Python
-
R
-
Ruby
-
Rust
-
Scratch
-
Swift
-
UML
-
UX/UI
-
Visual Basic
-
Wolfram
-
XML
-
АСУ
-
Проектирование/System Design
-
Сети/Network
-
Схемотехника/электронные схемы
Меню
1 Dataset 101 Visualizations Guidebook
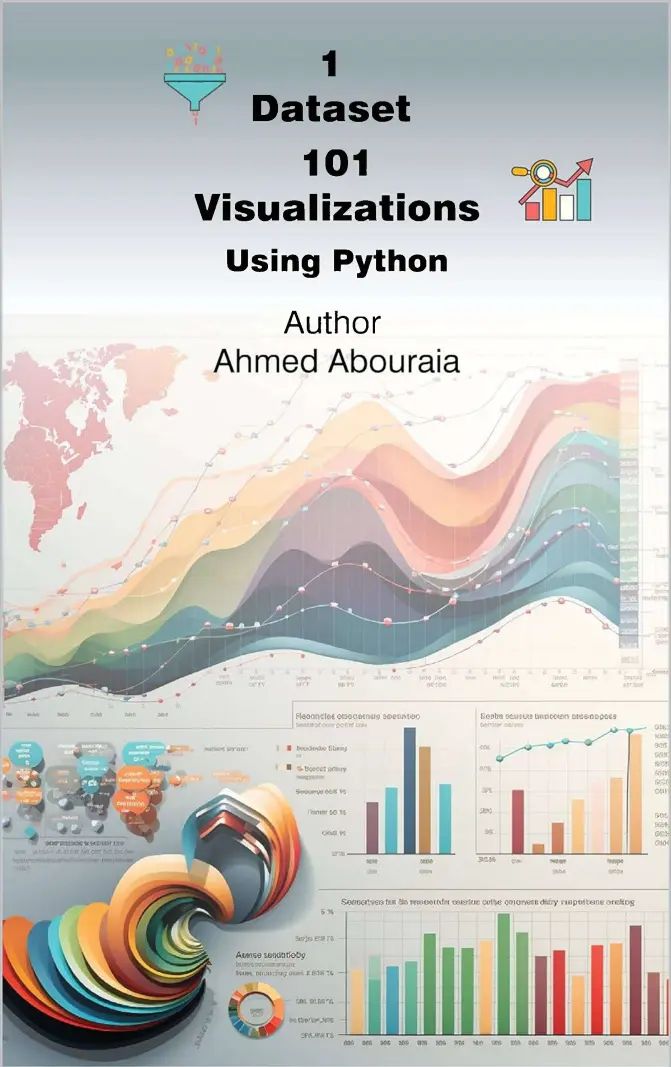
Автор: Abouraia Ahmed
Дата выхода: 2023
Издательство: Independent publishing
Количество страниц: 122
Размер файла: 6,7 МБ
Тип файла: PDF
Добавил: codelibs
Visualizations
1. About the Author, Copyright and Abstract
2. Getting Started with Data Visualization
3. Generating Synthetic Dataset with Faker
4. Visualizations with Python and Matplotlib
5. Conclusion
6. Useful resources
About the Author
Copyright © 2023 Ahmed Abouraia, Egypt.
Disclaimer
Abstract
1- Getting Started with Data Visualization
• Why Data Visualization Matters
• Effective Data Visualization:
Quantitative Data Visualization:
Qualitative Data Visualization:
• Python Libraries for Data Visualization
• Installing Required Libraries
• Using pip (Standard Python Distribution):
2- Generating Synthetic Dataset with Faker
• Installing Faker Library
• Generating Synthetic Sales Data
3- Visualizations with Python and Matplotlib
Ecommerce sales dataset was generated using Synthetic data approach using Python Faker library:
Dataset description:
101 Visualizations with Python: Code and Comprehensive Explanations for Every Visualization"
Sales Distribution by Customer Type
49.9%
Visualization 20: Stacked Percentage Bar Chart - Sales by Gender and Product
Visualization 21: Stacked Bar Chart - Total Sales by Gender and Customer
Beauty
H Books
Electronics
Female
Male
Sales Distribution by Customer Age Group
I HI UNI
Visualization 99: Violin Plot - Sales Distribution by Marital Status and Age Group:
Visualization 101: Stacked Bar Chart - Sales by Age and Marital Status
5. Conclusion:
6. Useful resources
Are you looking to level up your data visualization skills in Python? Look no further! Introducing the ultimate guide to 101 visualizations using just one dataset. Whether you're a beginner or an experienced data scientist, this comprehensive guide will take you on a visual journey through various plotting techniques, insights, and patterns that can be explored with Python and a single dataset. In this guide, we cover everything you need to know to create impactful visualizations and effectively communicate your data-driven stories. From basic bar charts to intricate heatmaps, we've got you covered. The dataset we'll be using comprises diverse attributes, including purchase details, customer demographics, product categories, and more.
Highlights of the Guide:
- Basics of Data Visualization in Python
- Line Plots: Uncovering Trends Over Time
- Bar Charts: Comparing Categories and Quantities
- Pie Charts: Analyzing Proportions
- Scatter Plots: Identifying Relationships
- Box Plots: Understanding Data Distribution
- Heatmaps: Visualizing Correlations
- Word Clouds: Exploring Textual Data ... and many more!
So grab your Python toolkit and embark on this exciting data visualization adventure! By the end of this guide, you'll have mastered various visualization techniques and gained invaluable insights from a single dataset.
