-
.NET (.NET Core)
-
1C
-
APL
-
AWK
-
Agda
-
Agile/Scrum
-
Alef
-
Assembler
-
Basic
-
Beta Programming Language
-
Big Data/DataScience
-
C
-
C#
-
C++
-
CSS
-
Cobol
-
Crystal
-
D
-
Dart
-
DataBase (SQL)
-
Delphi
-
F#
-
Flutter
-
Fortran
-
GPT/AI/ИИ
-
GameDev
-
Git
-
Go (Golang)
-
HTML
-
Hacking and Security
-
Haskell
-
Java
-
JavaScript (JS)
-
Julia
-
Kotlin
-
Machine Learning (ML)
-
Natural language processing (NLP)
-
PHP
-
Pascal
-
Python
-
R
-
Ruby
-
Rust
-
Scratch
-
Swift
-
UML
-
UX/UI
-
Visual Basic
-
Wolfram
-
XML
-
АСУ
-
Проектирование/System Design
-
Сети/Network
-
Схемотехника/электронные схемы
-
.NET (.NET Core)
-
1C
-
APL
-
AWK
-
Agda
-
Agile/Scrum
-
Alef
-
Assembler
-
Basic
-
Beta Programming Language
-
Big Data/DataScience
-
C
-
C#
-
C++
-
CSS
-
Cobol
-
Crystal
-
D
-
Dart
-
DataBase (SQL)
-
Delphi
-
F#
-
Flutter
-
Fortran
-
GPT/AI/ИИ
-
GameDev
-
Git
-
Go (Golang)
-
HTML
-
Hacking and Security
-
Haskell
-
Java
-
JavaScript (JS)
-
Julia
-
Kotlin
-
Machine Learning (ML)
-
Natural language processing (NLP)
-
PHP
-
Pascal
-
Python
-
R
-
Ruby
-
Rust
-
Scratch
-
Swift
-
UML
-
UX/UI
-
Visual Basic
-
Wolfram
-
XML
-
АСУ
-
Проектирование/System Design
-
Сети/Network
-
Схемотехника/электронные схемы
Меню
Troubleshooting Java: Read, debug, and optimize JVM applications
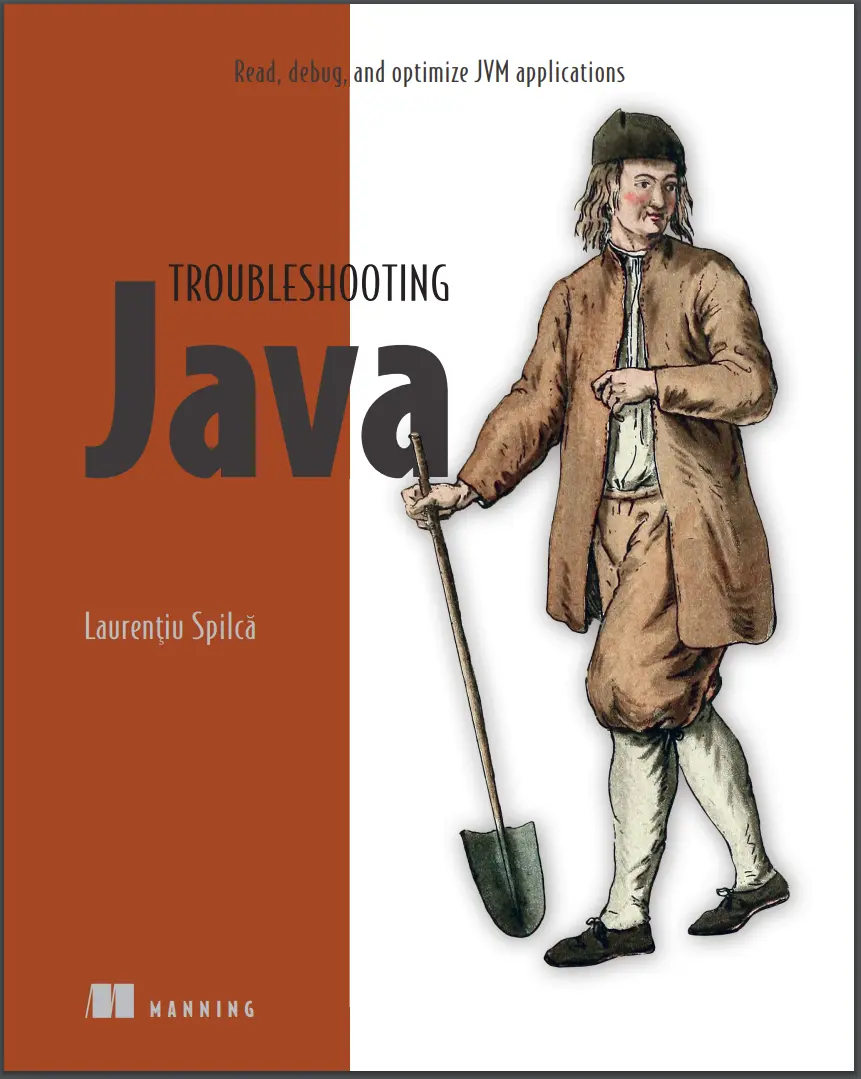
Автор: Spilca Laurentiu
Дата выхода: 2023
Издательство: Manning Publications Co.
Количество страниц: 329
Размер файла: 11,0 МБ
Тип файла: PDF
Добавил: codelibs
Troubleshooting Java....1
contents....5
preface....9
acknowledgments....11
about this book....13
Who should read this book....13
How this book is organized: A roadmap....14
About the code....15
liveBook discussion forum....15
Author online....15
about the author....16
about the cover illustration....17
Part 1: The basics of investigating a codebase....19
Chapter 1: Revealing an app’s obscurities....21
1.1 How to more easily understand your app....22
1.2 Typical scenarios for using investigation techniques....25
1.2.1 Demystifying the unexpected output....26
1.2.2 Learning certain technologies....31
1.2.3 Clarifying slowness....31
1.2.4 Understanding app crashes....33
1.3 What you will learn in this book....35
Chapter 2: Understanding your app’s logic through debugging techniques....37
2.1 When analyzing code is not enough....39
2.2 Investigating code with a debugger....42
2.2.1 What is the execution stack trace, and how do I use it?....47
2.2.2 Navigating code with the debugger....52
2.3 When using the debugger might not be enough....58
Chapter 3: Finding problem root causes using advanced debugging techniques....61
3.1 Minimizing investigation time with conditional breakpoints....62
3.2 Using breakpoints that don’t pause the execution....66
3.3 Dynamically altering the investigation scenario....69
3.4 Rewinding the investigation case....72
Chapter 4: Debugging apps remotely....79
4.1 What is remote debugging?....81
4.2 Investigating in remote environments....83
4.2.1 The scenario....84
4.2.2 Finding issues in remote environments....85
Chapter 5: Making the most of logs: Auditing an app’s behavior....97
5.1 Investigating issues with logs....101
5.1.1 Using logs to identify exceptions....102
5.1.2 Using exception stack traces to identify what calls a method....103
5.1.3 Measuring time spent to execute a given instruction....104
5.1.4 Investigating issues in multithreaded architectures....105
5.2 Implementing logging....107
5.2.1 Persisting logs....107
5.2.2 Defining logging levels and using logging frameworks....108
5.2.3 Problems caused by logging and how to avoid them....115
5.3 Logs vs. remote debugging....119
Part 2: Deep analysis of an app’s execution....123
Chapter 6: Identifying resource consumption problems using profiling techniques....125
6.1 Where would a profiler be useful?....126
6.1.1 Identifying abnormal usage of resources....126
6.1.2 Finding out what code executes....127
6.1.3 Identifying slowness in an app’s execution....128
6.2 Using a profiler....128
6.2.1 Installing and configuring VisualVM....128
6.2.2 Observing the CPU and memory usage....131
6.2.3 Identifying memory leaks....141
Chapter 7: Finding hidden issues using profiling techniques....147
7.1 Sampling to observe executing code....148
7.2 Profiling to learn how many times a method executed....157
7.3 Using a profiler to identify SQL queries an app executes....159
7.3.1 Using a profiler to retrieve SQL queries not generated by a framework....159
7.3.2 Using the profiler to get the SQL queries generated by a framework....164
7.3.3 Using the profiler to get programmatically generated SQL queries....167
Chapter 8: Using advanced visualization tools for profiled data....172
8.1 Detecting problems with JDBC connections....173
8.2 Understanding the app’s code design using call graphs....187
8.3 Using flame graphs to spot performance problems....189
8.4 Analyzing queries on NoSQL databases....193
Chapter 9: Investigating locks in multithreaded architectures....196
9.1 Monitoring threads for locks....197
9.2 Analyzing thread locks....202
9.3 Analyzing waiting threads....211
Chapter 10: Investigating deadlocks with thread dumps....220
10.1 Getting a thread dump....221
10.1.1 Getting a thread dump using a profiler....223
10.1.2 Generating a thread dump from the command line....225
10.2 Reading thread dumps....228
10.2.1 Reading plain-text thread dumps....228
10.2.2 Using tools to better grasp thread dumps....234
Chapter 11: Finding memory- related issues in an app’s execution....239
11.1 Sampling and profiling for memory issues....240
11.2 Using heap dumps to find memory leaks....247
11.2.1 Obtaining a heap dump....248
11.2.2 Reading a heap dump....252
11.2.3 Using the OQL console to query a heap dump....257
Part 3: Finding problems in large systems....265
Chapter 12: Investigating apps’ behaviors in large systems....267
12.1 Investigating communication between services....268
12.1.1 Using HTTP server probes to observe HTTP requests....269
12.1.2 Using HTTP client probes to observe HTTP requests the app sends....272
12.1.3 Investigating low-level events on sockets....273
12.2 The relevance of integrated log monitoring....276
12.3 Using deployment tools in investigations....282
12.3.1 Using fault injection to mimic hard-to-replicate issues....284
12.3.2 Using mirroring to facilitate testing and error detection....285
appendix A: Tools you’ll need....289
appendix B: Opening a project....290
appendix C: Recommended further reading....293
appendix D: Understanding Java threads....295
D.1 What is a thread?....296
D.2 A thread’s life cycle....298
D.3 Synchronizing threads....300
D.3.1 Synchronized blocks....300
D.3.2 Using wait(), notify(), and notifyAll()....302
D.3.3 Joining threads....304
D.3.4 Blocking threads for a defined time....305
D.3.5 Synchronizing threads with blocking objects....306
D.4 Common issues in multithreaded architectures....306
D.4.1 Race conditions....307
D.4.2 Deadlocks....307
D.4.3 Livelocks....309
D.4.4 Starvation....310
D.5 Further reading....310
appendix E: Memory management in Java apps....311
E.1 How the JVM organizes an app’s memory....312
E.2 The stack used by threads to store local data....314
E.3 The heap the app uses to store object instances....320
E.4 The metaspace memory location for storing data types....322
index....323
A....323
B....323
C....323
D....324
E....324
F....324
G....324
H....324
I....324
J....324
L....325
M....325
N....325
O....325
P....326
Q....326
R....326
S....326
T....327
U....327
V....327
W....327
X....327
Z....327
Effectively reading and understanding existing code is a developer’s superpower. In this book, you’ll master techniques for code profiling, advanced debugging, and log evaluation to find and fix bugs and performance problems.
In Troubleshooting Java: Read, debug, and optimize JVM applications you will learn how to:
- Determine what code does the first time you see it
- Expose code logic problems
- Evaluate heap dumps to find memory leaks
- Monitor CPU consumption to optimize execution
- Use thread dumps to find and solve deadlocks
- Easily follow a service-oriented or microservices system
- Properly use logging to better understand Java app execution
- Use Java debuggers efficiently
Searching for bugs, detangling messy legacy code, or evaluating your codebase for new features sucks up much of a developer's time. Troubleshooting Java: Read, debug, and optimize JVM applications teaches code investigation techniques that will help you efficiently understand how Java apps work, how to optimize them, and how to fix the bugs that break them. You’ll go from the basics of debugging to advanced methods for locating problems in microservices architectures, and save yourself hours—or even days—of time. Each new technique is explained with lively illustrations and engaging real-world examples.
About the technology
Fact: Over the course of your career, you’ll spend far more time reading code than you will writing it. The code investigation skills in this book will radically improve your efficiency in understanding and improving Java applications.
About the book
Troubleshooting Java: Read, debug, and optimize JVM applications presents practical techniques for exploring and repairing unfamiliar code. In it, you’ll learn timesaving practices for discovering hidden dependencies, discovering the root causes of crashes, and interpreting unexpected results. Go beyond profiling and debugging and start understanding how Java applications really work.
What's inside
- Determine what code does the first time you see it
- Evaluate heap dumps to find memory leaks
- Monitor CPU consumption to optimize execution
- Use thread dumps to find and solve deadlocks
- Uncover glitches in code logic
- Locate intermittent runtime problems
About the reader
For intermediate Java developers.
