-
.NET (.NET Core)
-
1C
-
APL
-
AWK
-
Agda
-
Agile/Scrum
-
Alef
-
Assembler
-
Basic
-
Beta Programming Language
-
Big Data/DataScience
-
C
-
C#
-
C++
-
CSS
-
Cobol
-
Crystal
-
D
-
Dart
-
DataBase (SQL)
-
Delphi
-
F#
-
Flutter
-
Fortran
-
GPT/AI/ИИ
-
GameDev
-
Git
-
Go (Golang)
-
HTML
-
Hacking and Security
-
Haskell
-
Java
-
JavaScript (JS)
-
Julia
-
Kotlin
-
Machine Learning (ML)
-
Natural language processing (NLP)
-
PHP
-
Pascal
-
Python
-
R
-
Ruby
-
Rust
-
Scratch
-
Swift
-
UML
-
UX/UI
-
Visual Basic
-
Wolfram
-
XML
-
АСУ
-
Проектирование/System Design
-
Сети/Network
-
Схемотехника/электронные схемы
-
.NET (.NET Core)
-
1C
-
APL
-
AWK
-
Agda
-
Agile/Scrum
-
Alef
-
Assembler
-
Basic
-
Beta Programming Language
-
Big Data/DataScience
-
C
-
C#
-
C++
-
CSS
-
Cobol
-
Crystal
-
D
-
Dart
-
DataBase (SQL)
-
Delphi
-
F#
-
Flutter
-
Fortran
-
GPT/AI/ИИ
-
GameDev
-
Git
-
Go (Golang)
-
HTML
-
Hacking and Security
-
Haskell
-
Java
-
JavaScript (JS)
-
Julia
-
Kotlin
-
Machine Learning (ML)
-
Natural language processing (NLP)
-
PHP
-
Pascal
-
Python
-
R
-
Ruby
-
Rust
-
Scratch
-
Swift
-
UML
-
UX/UI
-
Visual Basic
-
Wolfram
-
XML
-
АСУ
-
Проектирование/System Design
-
Сети/Network
-
Схемотехника/электронные схемы
Меню
Statistics and Data Visualisation with Python
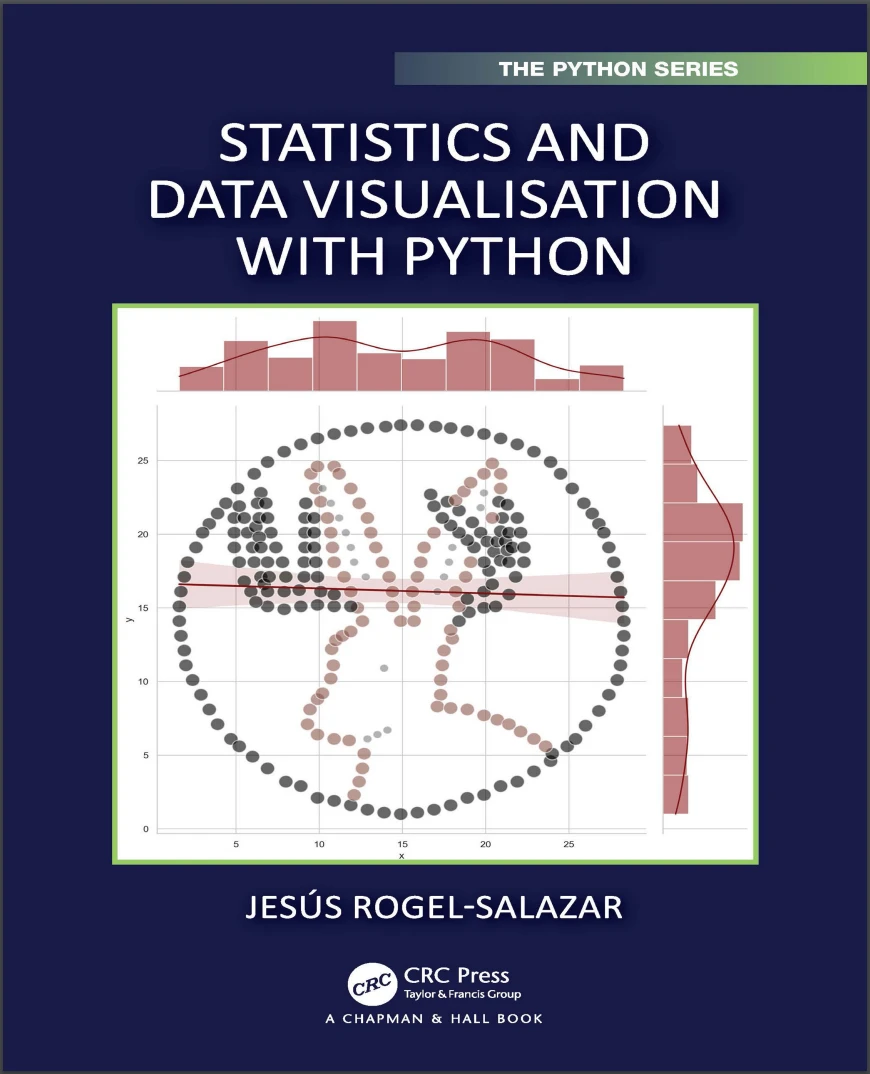
Автор: Rogel-Salazar Jesus
Дата выхода: 2023
Издательство: CRC Press is an imprint of Taylor & Francis Group, LLC
Количество страниц: 554
Размер файла: 14,3 МБ
Тип файла: PDF
Добавил: codelibs
1 Data, StatsandStories–AnIntroduction 1
1.1 FromSmalltoBigData 2
1.2 Numbers, FactsandStats 10
1.3 A SampledHistoryofStatistics 14
1.4 Statistics Today 22
1.5 Asking QuestionsandGettingAnswers 25
1.6 PresentingAnswersVisually 30
2 Python ProgrammingPrimer 33
2.1 TalkingtoPython 35
2.1.1 Scripting andInteracting 38
2.1.2 Jupyter Notebook 41
2.2 Starting UpwithPython 42
2.2.1 TypesinPython 43
2.2.2 Numbers: IntegersandFloats 43
2.2.3 Strings 46
2.2.4 Complex Numbers 49
2.3 Collections inPython 51
2.3.1 Lists 52
2.3.2 List Comprehension 60
2.3.3 Tuples 61
2.3.4 Dictionaries 66
2.3.5 Sets 72
2.4 The BeginningofWisdom:Logic&ControlFlow 80
2.4.1 Booleans andLogicalOperators 80
2.4.2 Conditional Statements 82
2.4.3 While Loop 85
2.4.4 For Loop 87
2.5 Functions 89
2.6 Scripts andModules 94
3 Snakes, Bears&OtherNumericalBeasts:NumPy,SciPy&pandas
99
3.1 Numerical Python–NumPy 100
3.1.1 Matrices andVectors 101
3.1.2 N-Dimensional Arrays 102
statisticsanddatavisualisationwithpython ix
3.1.3 N-Dimensional Matrices 104
3.1.4 Indexing andSlicing 107
3.1.5 Descriptive Statistics 109
3.2 Scientific Python–SciPy 112
3.2.1 Matrix Algebra 114
3.2.2 Numerical Integration 116
3.2.3 Numerical Optimisation 117
3.2.4 Statistics 118
3.3 Panel Data=pandas 121
3.3.1 Series andDataframes 122
3.3.2 Data Explorationwithpandas 124
3.3.3 Pandas DataTypes 125
3.3.4 Data Manipulationwithpandas 126
3.3.5 Loading Datatopandas 130
3.3.6 Data Grouping 136
4 The MeasureofAllThings–Statistics 141
4.1 Descriptive Statistics 144
4.2 MeasuresofCentralTendencyandDispersion 145
4.3 Central Tendency 146
4.3.1 Mode 147
4.3.2 Median 150
4.3.3 Arithmetic Mean 152
4.3.4 Geometric Mean 155
4.3.5 Harmonic Mean 159
4.4 Dispersion 163
4.4.1 Setting theBoundaries:Range 163
4.4.2 Splitting One’sSides:Quantiles,Quartiles,PercentilesandMore 166
4.4.3 Mean Deviation 169
4.4.4 VarianceandStandardDeviation 171
4.5 Data Description–DescriptiveStatisticsRevisited 176
5 Definitely Maybe:ProbabilityandDistributions 179
5.1 Probability 180
5.2 Random VariablesandProbabilityDistributions 182
5.2.1 Random Variables 183
5.2.2 DiscreteandContinuousDistributions 185
5.2.3 Expected ValueandVariance 186
5.3 DiscreteProbabilityDistributions 191
5.3.1 Uniform Distribution 191
5.3.2 Bernoulli Distribution 197
5.3.3 Binomial Distribution 201
5.3.4 HypergeometricDistribution 208
5.3.5 Poisson Distribution 216
statisticsanddatavisualisationwithpython xi
5.4 Continuous ProbabilityDistributions 223
5.4.1 Normal orGaussianDistribution 224
5.4.2 Standard NormalDistributionZ 235
5.4.3 Shape andMomentsofaDistribution 238
5.4.4 The CentralLimitTheorem 245
5.5 Hypothesis andConfidenceIntervals 247
5.5.1 Student’stDistribution 253
5.5.2 Chi-squaredDistribution 260
6 Alluring ArgumentsandUglyFacts–StatisticalModellingand
Hypothesis Testing 267
6.1 Hypothesis Testing 268
6.1.1 TalesandTails:One-andTwo-TailedTests 273
6.2 Normality Testing 279
6.2.1 Q-Q Plot 280
6.2.2 Shapiro-WilkTest 282
6.2.3 D’Agostino K-squaredTest 285
6.2.4 Kolmogorov-SmirnovTest 288
6.3 Chi-squareTest 291
6.3.1 Goodness ofFit 291
6.3.2 Independence 293
6.4 Linear CorrelationandRegression 296
6.4.1 Pearson Correlation 296
6.4.2 Linear Regression 301
6.4.3 Spearman Correlation 308
6.5 Hypothesis TestingwithOneSample 312
6.5.1 One-Sample t-testforthePopulationMean 312
6.5.2 One-Sample z-testforProportions 316
6.5.3 WilcoxonSignedRankwithOne-Sample 320
6.6 Hypothesis TestingwithTwoSamples 324
6.6.1 Two-Samplet-test–ComparingMeans,SameVariances 325
6.6.2 Levene’sTest–TestingHomoscedasticity 330
6.6.3 Welch’st-test–ComparingMeans,DifferentVariances 332
6.6.4 Mann-Whitney Test–TestingNon-normalSamples 334
6.6.5 PairedSamplet-test 338
6.6.6 WilcoxonMatchedPairs 342
6.7 Analysis ofVariance 345
6.7.1 One-factor orOne-wayANOVA 347
6.7.2 Tukey’sRangeTest 360
6.7.3 Repeated MeasuresANOVA 361
6.7.4 Kruskal-Wallis–Non-parametricOne-wayANOVA 365
6.7.5 Two-factororTwo-wayANOVA 369
statisticsanddatavisualisationwithpython xiii
6.8 TestsasLinearModels 376
6.8.1 Pearson andSpearmanCorrelations 377
6.8.2 One-sample t-andWilcoxonSignedRankTests 378
6.8.3 Two-Samplet-andMann-WhitneyTests 379
6.8.4 PairedSamplet-andWilcoxonMatchedPairsTests 380
6.8.5 One-way ANOVAandKruskal-WallisTest 380
7 Delightful Details–DataVisualisation 383
7.1 PresentingStatisticalQuantities 384
7.1.1 TextualPresentation 385
7.1.2 TabularPresentation 385
7.1.3 Graphical Presentation 386
7.2 Can YouDrawMeaPicture?–DataVisualisation 387
7.3 Design andVisualRepresentation 394
7.4 Plotting andVisualising:Matplotlib 402
7.4.1 Keep ItSimple:PlottingFunctions 403
7.4.2 Line StylesandColours 404
7.4.3 TitlesandLabels 405
7.4.4 Grids 406
7.5 Multiple Plots 407
7.6 Subplots 407
7.7 Plotting Surfaces 410
7.8 Data Visualisation–BestPractices 414
8 Dazzling DataDesigns–CreatingCharts 417
8.1 What IstheRightVisualisatonforMe? 417
8.2 Data VisualisationandPython 420
8.2.1 Data VisualisationwithPandas 421
8.2.2 Seaborn 423
8.2.3 Bokeh 425
8.2.4 Plotly 428
8.3 Scatter Plot 430
8.4 Line Chart 438
8.5 Bar Chart 440
8.6 Pie Chart 447
8.7 Histogram 452
8.8 Box Plot 459
8.9 AreaChart 464
8.10 Heatmap 468
A Variance:PopulationvSample 477
B SumofFirstnIntegers 479
C SumofSquaresoftheFirstnIntegers 481
statisticsanddatavisualisationwithpython xv
D TheBinomialCoefficient 483
D.1 Some UsefulPropertiesoftheBinomialCoefficient 484
E TheHypergeometricDistribution 485
E.1 The HypergeometricvsBinomialDistribution 485
F ThePoissonDistribution 487
F.1 Derivation ofthePoissonDistribution 487
F.2 The PoissonDistributionasaLimitoftheBinomialDistribution 488
G TheNormalDistribution 491
G.1 Integrating thePDFoftheNormalDistribution 491
G.2 Maximum andInflectionPointsoftheNormalDistribution 493
H SkewnessandKurtosis 495
I Kruskal-WallisTest–NoTies 497
Bibliography 501
Index 511
This book is intended to serve as a bridge in statistics for graduates and business practitioners interested in using their skills in the area of data science and analytics as well as statistical analysis in general. On the one hand, the book is intended to be a refresher for readers who have taken some courses in statistics, but who have not necessarily used it in their day-to-day work. On the other hand, the material can be suitable for readers interested in the subject as a first encounter with statistical work in Python. Statistics and Data Visualisation with Python aims to build statistical knowledge from the ground up by enabling the reader to understand the ideas behind inferential statistics and begin to formulate hypotheses that form the foundations for the applications and algorithms in statistical analysis, business analytics, machine learning, and applied machine learning. This book begins with the basics of programming in Python and data analysis, to help construct a solid basis in statistical methods and hypothesis testing, which are useful in many modern applications.
